Seasonal Suite
Unlock the Power of Seasonality with Our Custom Trading App for TradeStation
Are you ready to take your trading to the next level? Our Custom Trading App, built specifically for TradeStation, is designed to provide traders with a powerful tool for predicting market movements based on seasonal trends. Whether you're trading stocks, futures, or other financial instruments, this app offers unique insights that can help you make more informed trading decisions.
The Importance of Seasonal Trends in Trading
Seasonal trends play a crucial role in the financial markets. Understanding these patterns can give traders a significant edge. Market gurus like Jake Bernstein and Jeffrey Hirsch have long touted the benefits of studying seasonals. By leveraging the power of seasonal trends, traders can anticipate market movements and position themselves for success.
Key Features:
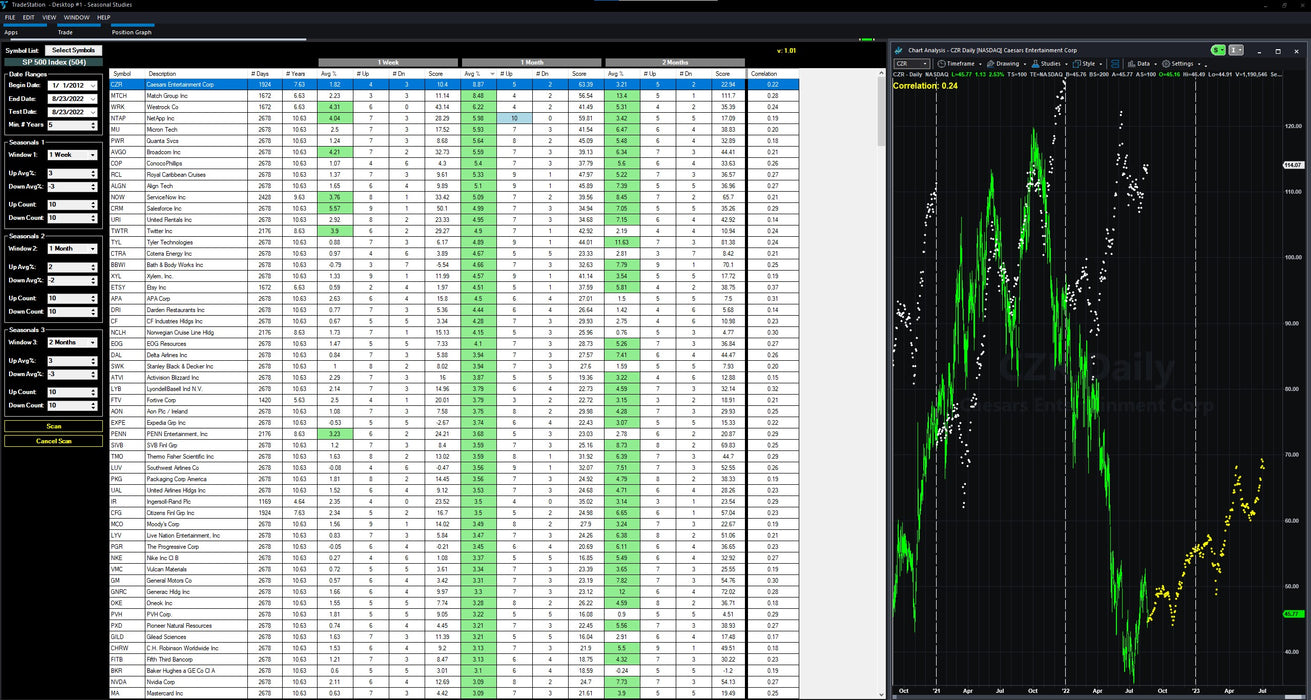
- Three Look-Forward Windows:
- Customize up to three look-forward time periods (e.g., 1 week, 1 month, 2 months).
- Gain insights into future market movements with our advanced prediction algorithms.
- Comprehensive Symbol List Analysis:
- Create and manage your own list of symbols to monitor.
- Our app scans through your selected symbols, providing expected average moves for your chosen look-forward periods.
- Analyze potential market movements for each symbol based on historical and seasonal data.
- Sortable Data-Grid Display:
- All data is presented in an intuitive, sortable data-grid format.
- Easily identify the greatest expected up or down moves for each instrument.
- Sort by different time periods to find the best trading opportunities.
Why Choose Our Custom Trading App?
- Enhanced Predictive Accuracy: By incorporating seasonal data, our app offers a more refined and accurate prediction of market trends.
- User-Friendly Interface: The intuitive data-grid display makes it easy to analyze and act on market data.
- Customizable Analysis: Tailor the app to your specific trading needs with customizable symbol lists and look-forward periods.
FAQs:
1. What does AVG % stand for?
The seasonal average move (up or down) for the forward window setting you used. So, if you set Window1 to 1 week, and Avg% says 5%, then on average, seasonally the stock moved up 5% over the course of the next week.
2. What does Score stand for?
A scoring mechanism that uses the Avg%, #Up days, #Down days. Here is the formula:
Score = ( #Up / (#Up + #Dn) ) * 10 * Avg%;
You can then sort your list by Score (double-click the grid header) to pull the strongest/weakest from a standardized scoring perspective, taking all knowns wrapped into one score.
3. What does Correlation stand for?
How correlated the last year's actual move was to the seasonally expected move.